KAER LABS

Segmentation example of a mouse heart vascular network in 3D
From raw data to 3D reconstruction
This page describes the operations that are performed on the image stacks obtained with the Kinsight in order to visualize them in 3D and to segment a specific set of objects in the acquisition, with an example of a mouse heart and the segmentation of vessels within the organ. The analysis operations depends of course of the images and the objects to segment, but this example highlights operations that are frequently used for the acquisitions from the Kinsight.
In our mouse heart example, the vessels that we want to segment appear black in the raw data, as shown in the first video.
1) IMAGE REGISTRATION AND STACK PREPARATION WITH FIJI
The registration process is made of four steps:
-
Rigid registration of the images on the vertical axis (y axis)
This step makes use of the plugin "3D correct drift" from Fiji. It corrects the shift that can result from the variability of repositioning of certain microtomes.
-
Image calibration
By using the function "Analyze >> Set scale" on Fiji, one can set the size of the image (e.g. 1024 pixels correspond to 30 mm in case of a 30 mm field of view)
-
Image crop
It may be worth cropping images in order to focus on the zone of interest (Image >> Crop)
-
Background removal
This step makes use of the plugin "Subtract background" from Fiji
Left: raw images from mouse heart. Right: image stack after registration, calibration, cropping and background removal
2) THRESHOLDING AND SEGMENTATION WITH FIJI
Two steps can be necessary to get a segmented stack:
-
Cleaning the image before thresholding
This step makes uses of image filters, the choice depending on the type of signal distribution and noise in the image. Filters like median filter, or Gausian filter can help (Process >> Filter...)
-
Threshold
By using the function "Image >> Adjust >> Threshold..." on Fiji, one can select the desired threshold value in order to isolate the areas of interest in the image stack.
-
Morphology
Erosion, dilation, opening & closing operations will generate the desired segmented image.
Left: the previously registered image stack. Right: image stack after a Gaussian filter, a threshold operation and morphology operations
3) VISUALIZATION WITH NAPARI
Once an image stack has been processed and segmented with ImageJ or Fiji, it can then be opened directly with the free software program napari. napari will automatically propose a 3D visualization of the image stack. It can then be used for advanced analysis and measurement of volumes.

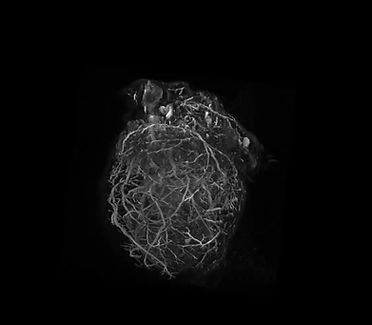
Left: 3D heart rendering. Right: 3D rendering of the heart vascular network as segmented with the various steps described in this page